Tickets
How your tickets arrive, move and end.
What automation closed, what reached your team, how fast it was solved, and why tickets were handed over.
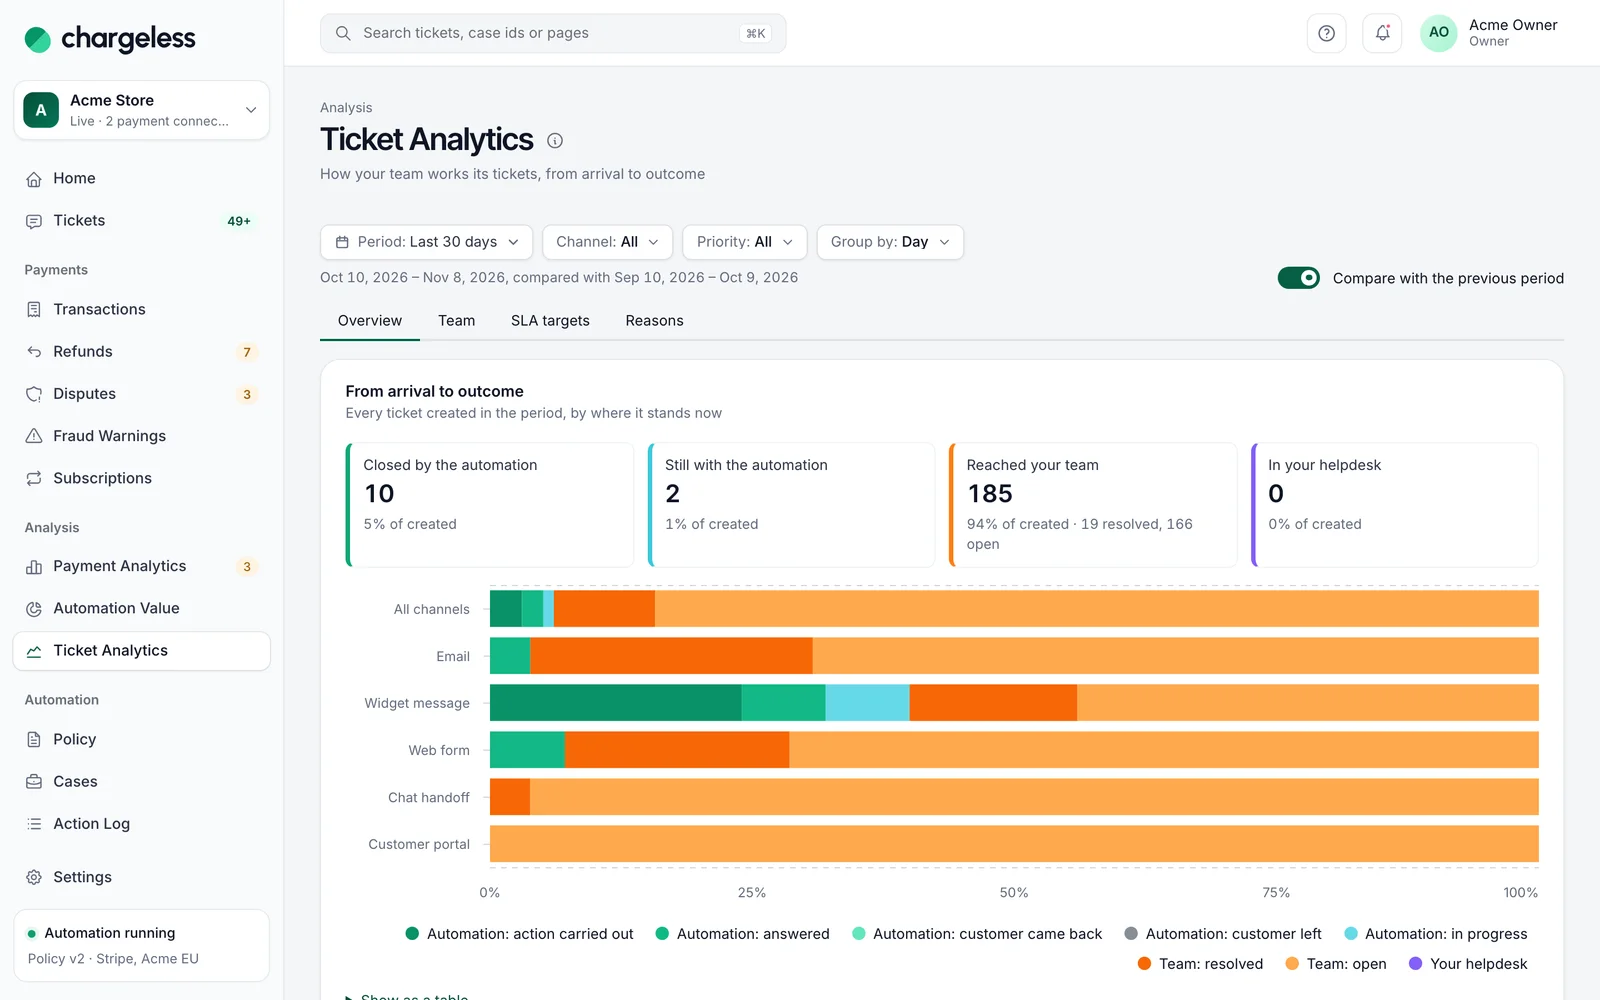
From arrival to outcome
Every ticket of the period by where it stands now, per channel. Tiles show created, resolved, reopened and backlog, with median reply and solve times.
- Every path, per channel
- Created, resolved, backlog
- Median reply and solve time
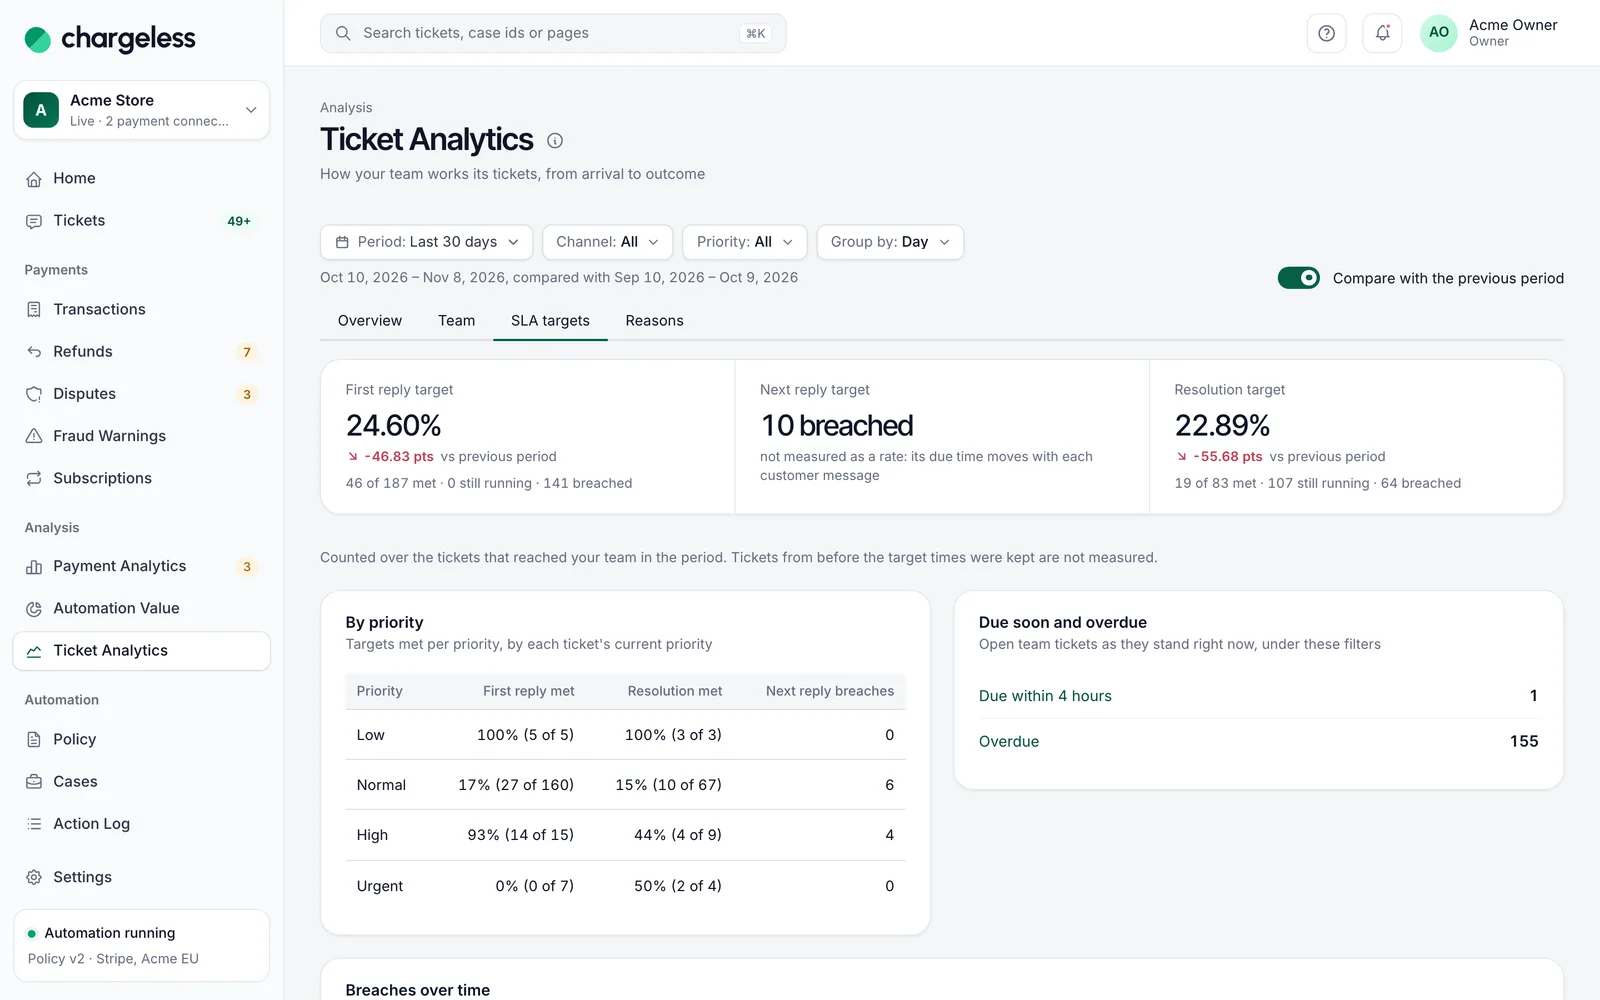
Targets, team and reasons
Targets met, each member’s workload and response times, and why tickets came to your team: your best hint for a policy change.
- Targets met per priority
- Per-member figures
- Handoff reasons
Filters and the fine print
Filter by channel and priority, group by day or week. Helpdesk tickets are counted, but kept out of the team’s figures.
- Channel and priority filters
- Day or week grouping
- Helpdesk tickets apart
Last 30 days
Executed automatically71%
Handed to your team20%
Median first reply1 h 40 m
More in Tickets
Start with low limits. Raise them when the record shows it works.
Start in test mode, run your policy against your own history, and go live when the results meet your standards.
- 1A test workspace on your provider’s test mode
- 2Your past requests replayed against your policy
- 3Live with low limits, raised as the record allows